The Best Stock Moves Often Begin Where Nobody Is Looking
Where the fast money is....
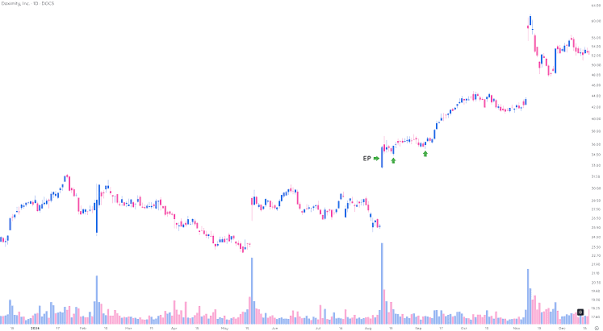
How to identify Episodic Pivots and Delayed Episodic Pivots in Indian equities—before the opportunity becomes obvious to everyone.
Most traders are obsessed with stocks that are already moving.
They scan for 52-week highs, strong relative strength, rising moving averages, and stocks that have already delivered 30%, 50%, or even 100% returns.
There is nothing inherently wrong with that approach. Momentum trading works.
But there is another category of opportunities that I find particularly interesting.
Stocks that have done absolutely nothing for months—and then suddenly wake up.
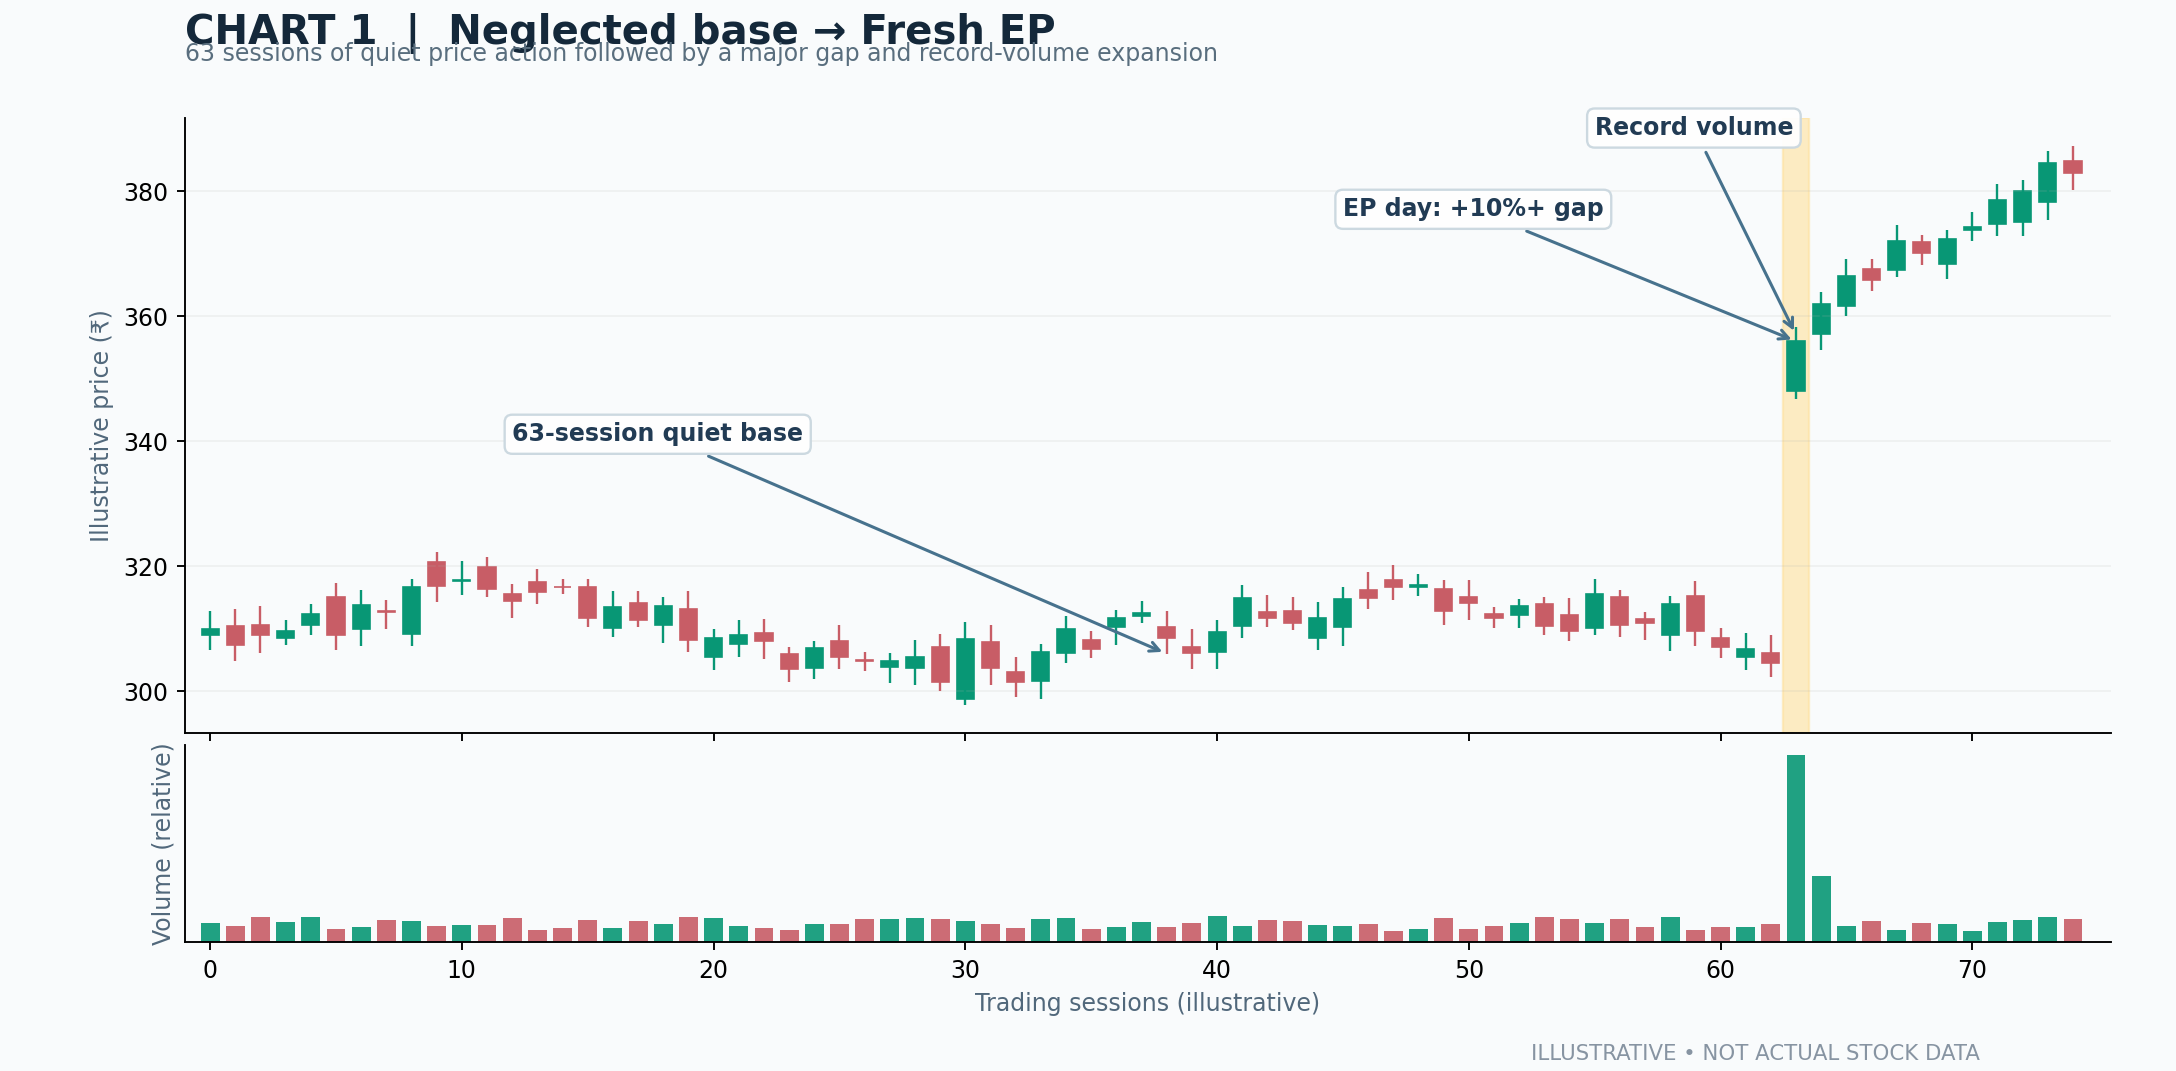
Imagine a company whose share price has been moving between ₹300 and ₹350 for three months.
Volumes are ordinary. Nobody is discussing it on social media. There is very little institutional excitement. The stock has been forgotten.
Then one morning, the company announces exceptional quarterly earnings.
Revenue has grown 60%. Profits have doubled. Management raises its full-year guidance.
The stock opens 12% higher, trades five times its normal volume, and closes near the day's high.
Something has changed.
This isn't necessarily a normal technical breakout. The market may be responding to information that materially changes the company's future earnings potential.
This phenomenon is called an Episodic Pivot (EP).
And understanding it can completely change how you approach earnings season.
1. What Exactly Is an Episodic Pivot?
The concept was popularised by trader Pradeep Bonde of Stockbee and subsequently developed and discussed extensively by Kristjan Kullamägi, better known as Qullamaggie.
The logic is relatively simple.
Every stock has a set of expectations embedded in its price.
Those expectations are influenced by past growth, future earnings estimates, management credibility, industry conditions, and investor sentiment.
Most of the time, information changes gradually.
But occasionally, something unexpected happens that forces investors to reconsider the business almost overnight.
Perhaps a company that was expected to grow at 15% suddenly reports 70% revenue growth.
Perhaps a manufacturer receives an order that materially increases its revenue visibility.
Perhaps a struggling business appoints new leadership and announces a credible turnaround plan.
The market now has to answer a new question:
What if this company is worth substantially more than we previously believed?
When the new information is important enough, investors begin buying aggressively.
This is where price and volume come together.
The news provides the reason.
The price movement reveals the market's reaction.
The volume tells us how much participation is behind that reaction.
A strong EP ideally combines all three.
2. Why I Prefer Stocks That Have Been Neglected for Three Months
Consider two hypothetical stocks.
Stock A has already appreciated 80% over the previous three months. Its moving averages are rising sharply, and investors are extremely optimistic.
It reports good quarterly results and rises another 10%.
Stock B has spent three months trading sideways. Expectations are muted and investor attention is limited.
It reports unexpectedly strong results and rises 10% on enormous volume.
Which situation is more interesting?
I would usually investigate Stock B first.
The distinction is not simply the percentage move.
It is the difference between what investors already expected and what they have just discovered.
In Stock A, much of the good news might already be reflected in the price.
In Stock B, the market may only be beginning to recognise the change.
This is why I place significant importance on the period before the EP day.
For my Indian-market framework, I prefer:
At least 63 trading sessions, approximately three months, of consolidation.
A three-month price change between −15% and +15%.
A total high-to-low trading range of no more than 35%.
No previous single-day closing gain of 9% or more during that period.
No advance greater than 12% over the preceding 20 trading sessions.
These are my screening thresholds, not universal rules established by Qullamaggie or Bonde.
Their purpose is to eliminate stocks that are already in an obvious momentum phase.
I am looking for a change in character.
A stock that goes from being ignored to attracting unusually large amounts of capital deserves attention.
3. The Original EP: What I Look For on the Breakout Day
My preferred EP is not simply any stock that rises 10%.
A stock can rise sharply because of speculation, an illiquid order book, a short squeeze, or a temporary news event.
That does not necessarily create a sustainable opportunity.
I want multiple conditions to align.
The price must behave differently
My strict Indian-market screen requires an opening gap of at least 10% and a close-to-close gain of at least 10%.
The stock should also break above its previous 20-session high.
A large gap tells me the market reassessed the company before normal trading even began.
A strong close suggests buyers maintained control throughout the session.
I prefer the stock to close within the upper 25% of its daily trading range.
For example, if a stock trades between ₹400 and ₹440 during the session, I would prefer a close above ₹430.
A stock that opens 15% higher but finishes near its daily low may indicate that early enthusiasm was met with aggressive selling.
Volume must be exceptional
Volume is one of the most important elements of the EP setup.
My minimum threshold is four times the average daily volume of the preceding 20 sessions.
But I am particularly interested in something stronger.
What if the EP day records the highest daily trading volume in an entire year?
That is a much more unusual event.
It indicates that trading activity has shifted dramatically relative to the stock's recent history.
I classify volume into three categories:
Volume event | Definition |
|---|---|
Quarterly volume record | Higher than every preceding daily volume in 63 sessions |
Yearly volume record | Higher than every preceding daily volume in 252 sessions |
Five-year volume record | Higher than every preceding daily volume in five years, where data is available |
A yearly volume record does not prove institutional buying. Volume includes both buyers and sellers, and can also be driven by speculation.
However, it gives us a compelling reason to investigate the price move more closely.
The catalyst must be meaningful
The best EPs are often driven by a change in business fundamentals.
During earnings season, I pay particular attention to accelerating revenue growth, accelerating profits, large earnings surprises, and management guidance upgrades.
For example:
Fundamental metric | Previous quarter | Latest quarter |
|---|---|---|
Revenue growth YoY | 22% | 65% |
PAT growth YoY | 18% | 135% |
EBITDA margin | 11% | 15% |
Management outlook | Stable | Upgraded |
Illustrative figures, not an actual company's results.
This is more interesting than a company that has consistently reported 50% growth but now delivers another ordinary 50% quarter.
The market responds to surprises, not merely to good absolute numbers.
A 35% earnings increase can be more consequential than a 100% increase if expectations were completely different.
That is why I examine both the numbers and the expectations surrounding them.
4. The Catalysts That Can Create an EP
Although quarterly earnings are especially important, they are not the only events that can change investor expectations.
I classify EP catalysts into several categories.
Earnings acceleration: A meaningful improvement in sales, operating profit, PAT, margins, or forward guidance. I prefer growth supported by recurring operations rather than exceptional income.
Management changes: Appointment of an experienced CEO, a new promoter-backed leadership team, or management changes accompanied by a credible operational turnaround.
Major order wins: Contracts large enough to change future revenue visibility. An ₹800 crore order matters very differently to a company generating ₹1,000 crore in annual revenue than to one generating ₹50,000 crore.
New products or business lines: Commercial launches that can open a significantly larger addressable market or improve profitability.
Capacity expansions: Commissioning of new facilities that remove a genuine production bottleneck and are supported by customer demand.
Acquisitions and strategic partnerships: Transactions that provide access to valuable technology, new customers, important distribution networks, or higher-margin businesses.
Regulatory or policy developments: Approvals or policy changes that materially improve a company's commercial prospects.
The important question is not whether an announcement sounds exciting.
It is whether the announcement can materially change the company's future earnings power.
A headline is not automatically a catalyst, and a catalyst is not automatically an EP.
The market's actual response remains essential.
5. Why I Don't Always Want to Buy on the EP Day
An EP can be powerful, but the entry is not always attractive.
Imagine a stock closes at ₹300 and announces exceptional earnings.
The next morning, it opens at ₹340 and immediately rallies to ₹370.
The stock is clearly attracting interest.
But what happens if it reverses to ₹335?
Buying aggressively after a large opening move can expose a trader to substantial downside.
Qullamaggie's published approach involves monitoring early-session volume, using opening-range breaks for potential entries, and referencing the low of the day for risk management.
That is one approach.
Personally, I am also interested in a second opportunity.
What happens when the stock makes its initial EP move, pauses for several sessions, and then forms a tight setup near its short-term moving averages?
This is where the Delayed Episodic Pivot becomes interesting.
6. Delayed EP: Let the Stock Rest Before the Next Move
The original EP is the moment something changes.
The Delayed EP is an attempt to participate after the stock has absorbed that change and formed a more manageable technical structure.
Consider this hypothetical sequence.
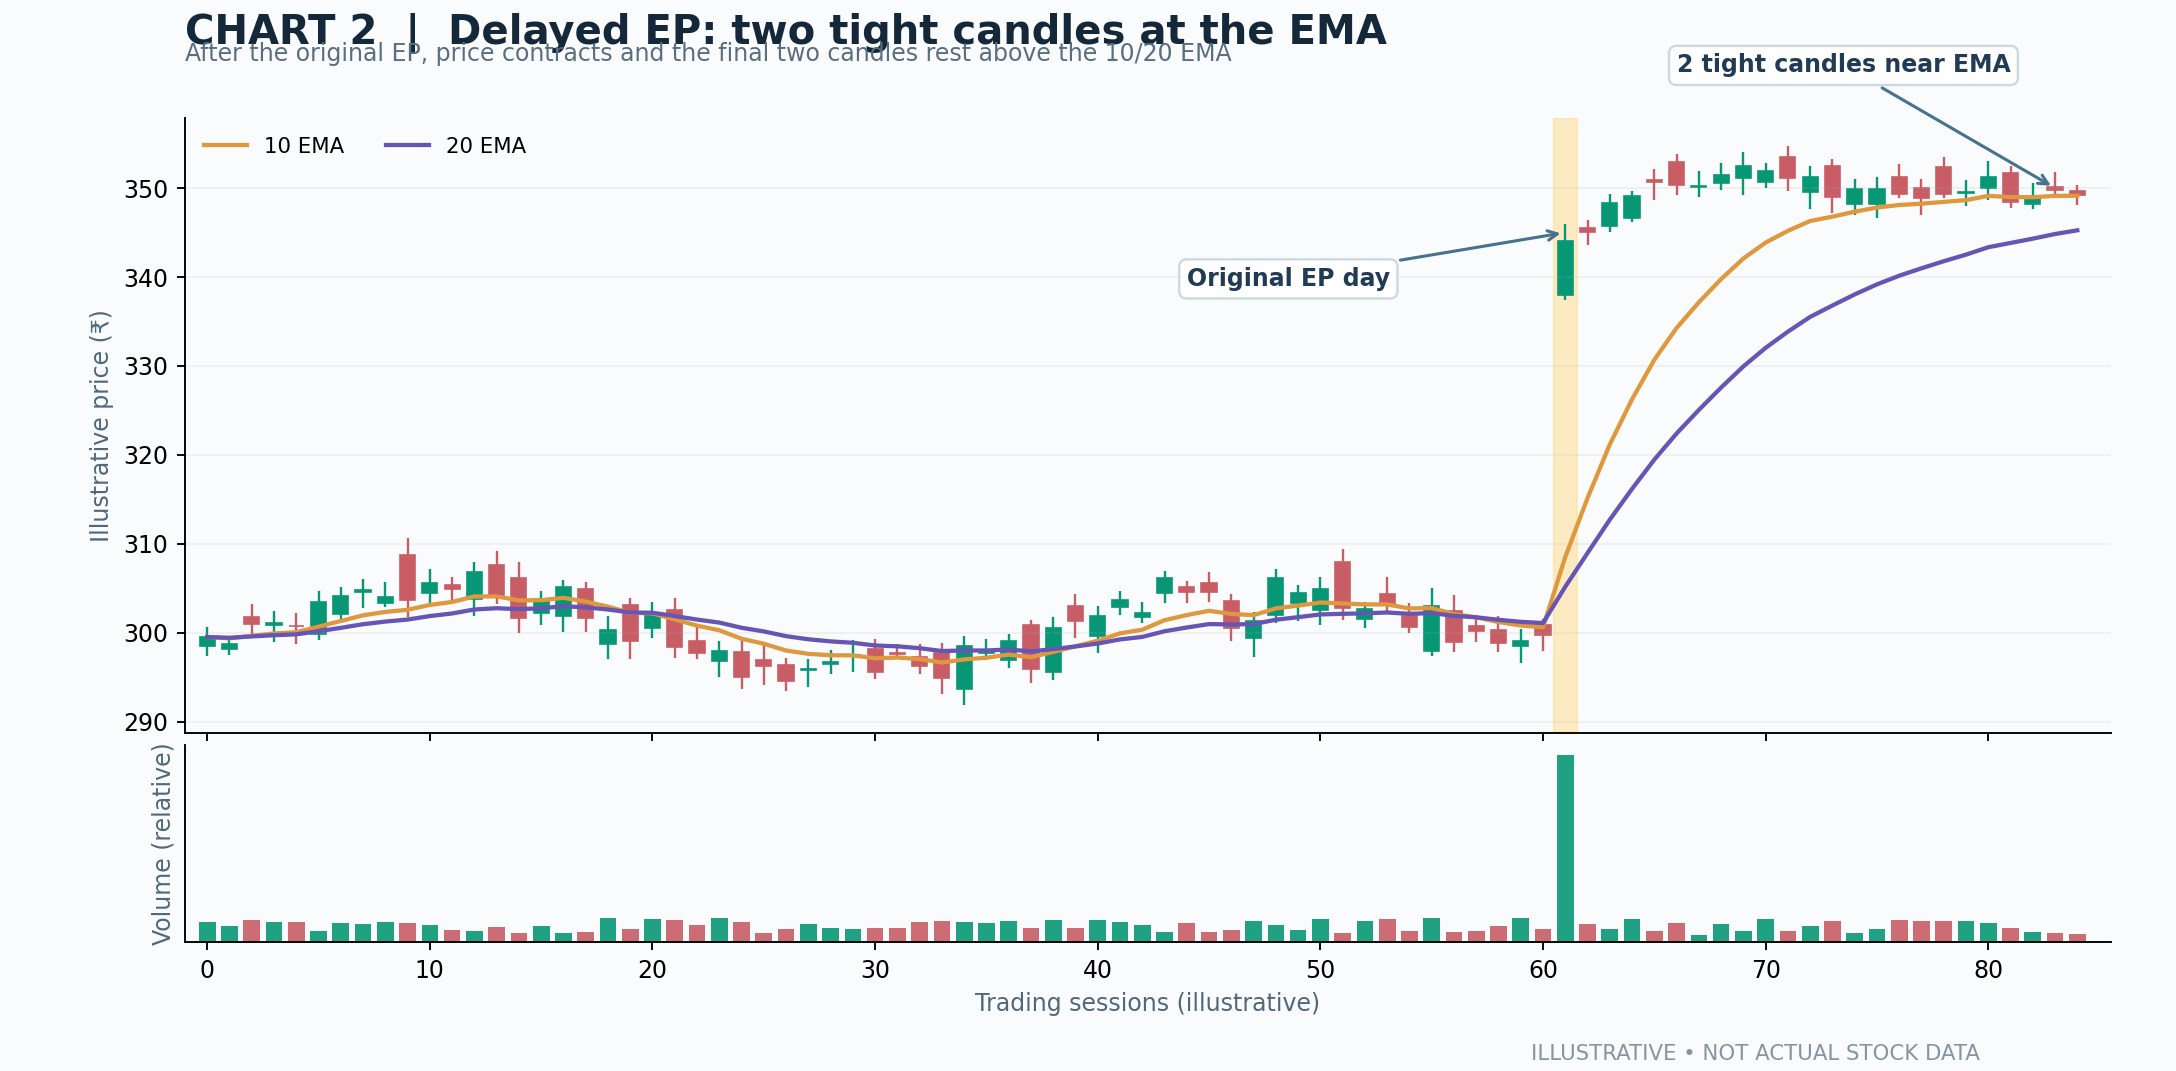
A stock spends three months consolidating between ₹280 and ₹320.
Then it reports strong earnings.
On the EP day, it rises 13% on five times its normal volume.
Over the following sessions, it consolidates.
The 10-day and 20-day exponential moving averages begin catching up with the price.
Eventually, the stock prints two relatively tight candles near those averages.
To me, that is worth watching.
The stock has already demonstrated that something important may have changed.
Now the objective is to find a technically controlled point of entry rather than chase the original expansion candle.
My Delayed EP rules
First, the original EP must qualify as a meaningful price-volume event:
An original EP-day closing gain of at least 10%.
Relative volume of at least four times normal.
A strong close within the upper 25% of the daily range.
A preceding three-month period of consolidation or neglect.
Then I examine the subsequent setup, ideally between three and fifteen trading sessions after the original EP.
The last two candles should have relatively small bodies, with each opening-to-closing change between −3% and +3%.
Each candle's full high-to-low range should be no greater than 5%, while the combined two-candle range should be no greater than 6%.
Both candles must close above the 10 EMA and 20 EMA.
Importantly, they must actually be resting near a moving average.
I define that as closing within 3% above either the 10 EMA or the 20 EMA.
This permits a stock to consolidate near the faster 10 EMA or retrace toward the slower 20 EMA.
It does not permit a stock trading 10% or 15% above both moving averages to be treated as a tight resting setup.
I also prefer the two closes to remain within 3% of each other.
The central idea is contraction after expansion.
A large event attracts attention. A controlled consolidation allows the market to absorb the initial supply. A subsequent breakout may suggest that demand remains present.
Of course, the same pattern can fail. Tight candles do not guarantee accumulation or continuation.
7. The Entry, Stop-Loss and Risk
For a Delayed EP, my technical reference is straightforward.
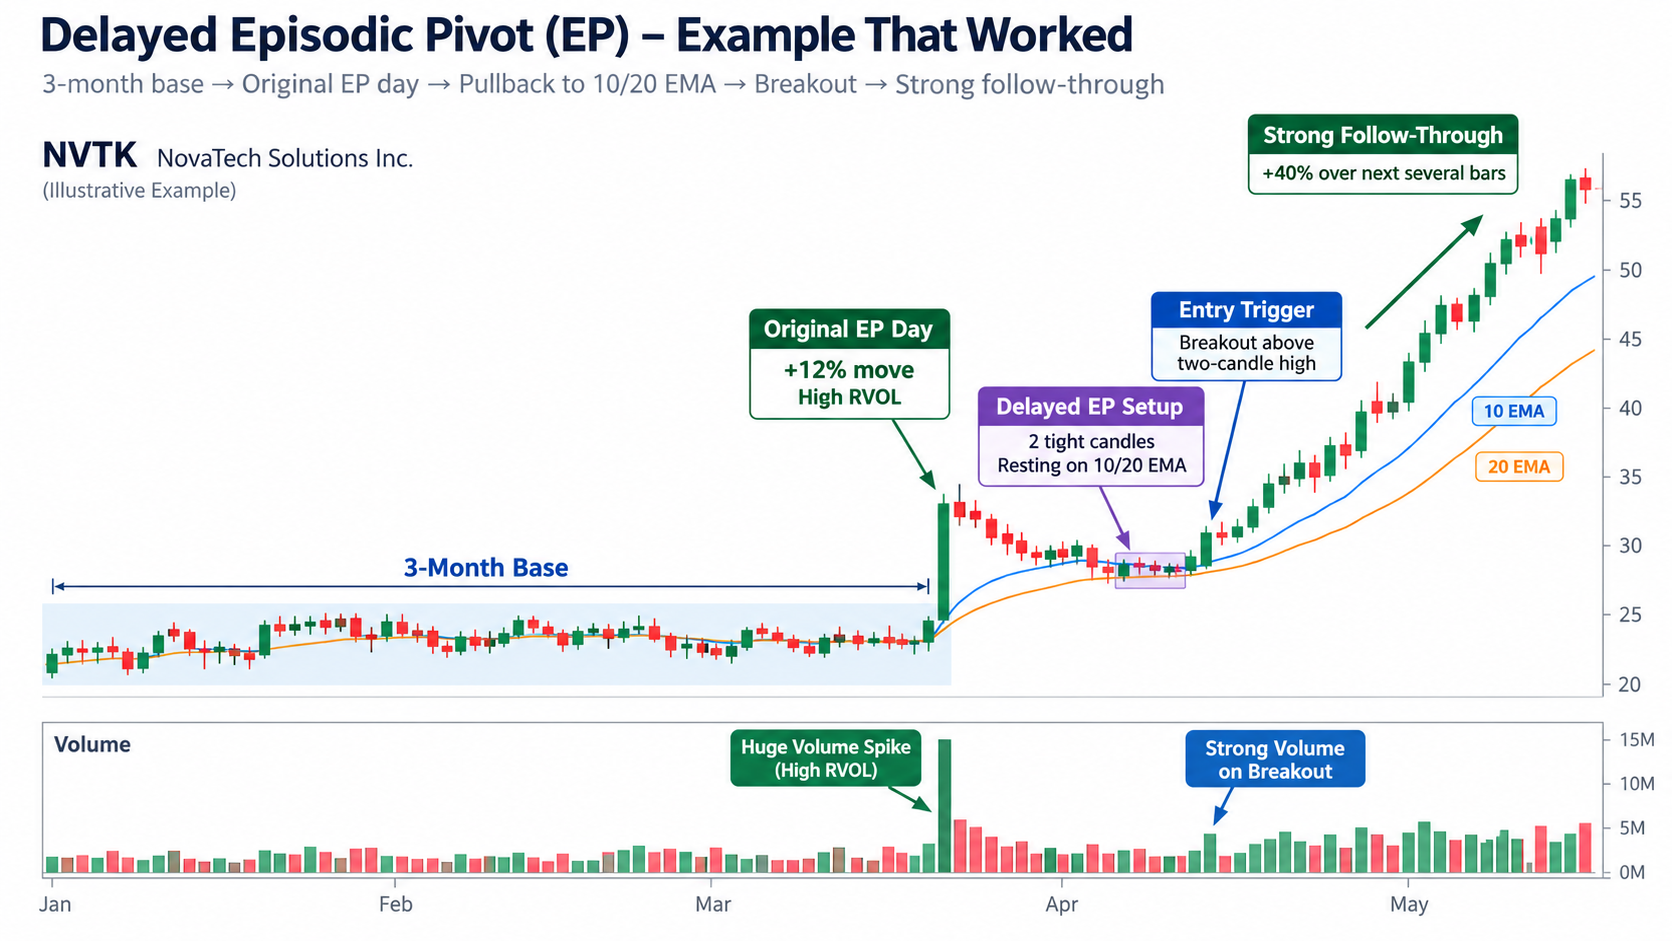
The potential entry trigger is a breakout above the higher high of the two tight candles.
The initial stop reference is the lower low of those same candles.
Suppose the two candles have a combined high of ₹425 and a combined low of ₹407.
A breakout above ₹425 might become the entry trigger.
The structural risk from ₹425 to ₹407 is approximately 4.2%, before transaction costs and slippage.
But I would not take the trade merely because the trigger is reached.
I would examine whether the stock is extended, whether the broader market supports new positions, and whether the available reward justifies the risk.
A breakout that opens substantially above the intended entry price can invalidate the original risk calculation.
Never increase position size simply because a setup looks exceptional.
A powerful catalyst does not remove the possibility of a failed trade.
8. Applying This Framework to Indian Stocks
The Indian equity market has thousands of listed companies, but many smaller stocks lack sufficient trading liquidity for active strategies.
A chart can look perfect and still be difficult to trade.
This is why my screening universe is deliberately restricted.
Parameter | My screening condition |
|---|---|
Market | NSE equities |
Market capitalisation | ₹1,000–50,000 crore |
Daily traded value | Above ₹10 crore |
Prior consolidation | Approximately three months |
Original EP gain | At least 10% |
Relative volume | At least 4× |
Strong closing | Upper 25% of daily range |
Delayed entry setup | Two tight candles near 10/20 EMA |
The liquidity threshold is a minimum requirement, not a guarantee of good execution.
I would also examine bid-ask spreads, average turnover, delivery characteristics, and concentration of trading volume.
A stock can trade ₹20 crore on one exceptional day but average only ₹1 crore on ordinary sessions.
That creates a very different liquidity profile.
9. How I Rank My Best EP Candidates
A scanner should not simply produce a list of fifty names and leave the investor overwhelmed.
I prefer ranking candidates based on the quality of the underlying setup.
My highest-priority candidate would ideally exhibit five characteristics.
First, a neglected base. The stock has spent at least three months trading sideways without an obvious preceding momentum run.
Second, a genuinely meaningful catalyst. There is an identifiable announcement capable of changing the business outlook.
Third, exceptional volume. Preferably the highest volume in a quarter or year, rather than just a modest relative-volume increase.
Fourth, a convincing price reaction. The stock gaps or rises sharply and closes near its daily high.
Fifth, a controlled entry structure. If the original EP entry is too extended, I prefer a subsequent tight consolidation near the 10 EMA or 20 EMA.
A candidate meeting all five conditions deserves closer attention than a stock that simply jumps 10% on vague news.
But a ranking score is not a measured probability of success.
No scanner can reliably convert a handful of technical metrics into a guaranteed win rate.
The purpose of ranking is to direct research toward the strongest-looking situations.
10. Why Most EP Scanners Produce Too Much Noise
This is one of the biggest practical problems with automated momentum screening.
If I ask a scanner to show every stock that has risen more than 8% with twice its normal volume, it will produce a large collection of unrelated situations.
Some stocks are already in mature uptrends.
Some have poor liquidity.
Others have rallied due to temporary speculative activity.
Some have no identifiable business catalyst.
And some experienced genuine earnings surprises but closed weakly after their initial gap.
These are not equivalent opportunities.
A useful EP scanner must understand what happened before, during, and after the event.
Before the event: Was the stock neglected?
During the event: Was there a surprise accompanied by exceptional price and volume?
After the event: Did the stock hold its gains, or did the entire move immediately reverse?
For Delayed EPs, there is another question:
Has the stock developed a tight consolidation near its moving averages, or is it simply continuing an extended advance?
The more carefully these situations are separated, the more useful the watchlist becomes.
There is a trade-off, however.
Every additional condition reduces the number of candidates. Extremely strict rules can exclude genuine winners alongside weak setups.
That is why the screening thresholds should eventually be tested against historical Indian market data rather than treated as permanent truths.
11. The Biggest Mistakes to Avoid
The first mistake is confusing a large price move with a genuine fundamental change.
Not every 10% move is an EP.
The second is ignoring what happened before the move.
A stock that has already doubled may respond very differently to good news than one emerging from a long period of neglect.
The third is treating headline PAT growth as sufficient evidence.
Exceptional gains, low-base effects, tax adjustments, and non-recurring income can make profits appear far stronger than underlying operations.
The fourth is chasing a stock far above its moving averages simply because the original EP was impressive.
The fifth is assuming unusually high volume guarantees future appreciation.
Volume confirms activity, not the direction of future returns.
Finally, many traders spend more time adjusting scanner parameters than studying actual charts.
That is backwards.
The real advantage comes from reviewing historical examples, studying failed setups, and understanding why apparently similar patterns produce very different outcomes.
A scanner finds candidates.
Research establishes the context.
Risk management determines whether an idea is worth trading.
12. What I Ultimately Want to Find
I am not necessarily searching for the strongest stock in the market today.
I am searching for a stock that could become substantially stronger because something important has just changed.
A company that was ignored for months.
An earnings result that surprises investors.
A management decision that changes the business outlook.
A significant order or product launch that transforms future revenue visibility.
A sudden expansion in price and trading volume.
And, ideally, a controlled consolidation offering a more manageable entry.
The sequence matters:
Neglect → Surprise → Price expansion → Exceptional volume → Consolidation → Potential continuation.
No part of this sequence guarantees a profitable trade. Some of the most impressive EPs reverse immediately, and some of the strongest delayed setups fail at their breakout levels.
But the framework gives me a disciplined way to focus on a particular type of market opportunity.
Rather than chasing every stock that is moving, I can search for businesses where the market may be recognising a new reality.
That is the real attraction of Episodic Pivots.
The opportunity is not simply that a stock has moved. It is that something may have changed—and the market may only be beginning to price it in.